There’s going to be a change in the newsletter from now onwards.
After this issue, I’m migrating to Beehiiv. From the front end, it’ll look no different on the home page where you log in.
After that, the posts will look better and you’ll definitely be emailed whenever I have a new post up.
I didn’t know about Beehiiv at the time otherwise I would’ve likely signed up with them straight away – Substack has a lot of complications and I didn’t like some of the limitations.
The whole process will be smoother as this tech stack is specifically designed for subscription businesses like this.
In any case, the theme this month is energy and resources!
In particular, I’ve noticed gold is threatening to break all-time highs.

Gold is said to rise when inflation soars but looking at the chart we can see that theory didn’t hold true last year, when inflation ramped up quickly and gold took a pounding.
Personally, I don’t trade commodities.
There are too many people with bigger brains, bigger bankrolls, and bigger computers.
So me trading from the spare bedroom isn’t quite going to cut it.
Where the alpha can potentially lie though is in trading stocks that are correlated to this price – gold companies and mainly producers.
Notice how many of the charts are looking similar.
Anglo Asian Mining (AAZ)

Anglo Asian Mining has spent much of the 2021 boom year in decline and 2022 didn’t see its fortunes changing much either. It’s a -61% move from peak to trough, and a clear reason why holding onto downtrending stocks is a mug’s game.
But there was plenty of alpha up for grabs in the uptrend.

However, AAZ looks like it could be testing the 120p level in a cup and handle formation.
That seems to be the case at Caledonia Mining too (CMCL).
Caledonia Mining (CMCL)
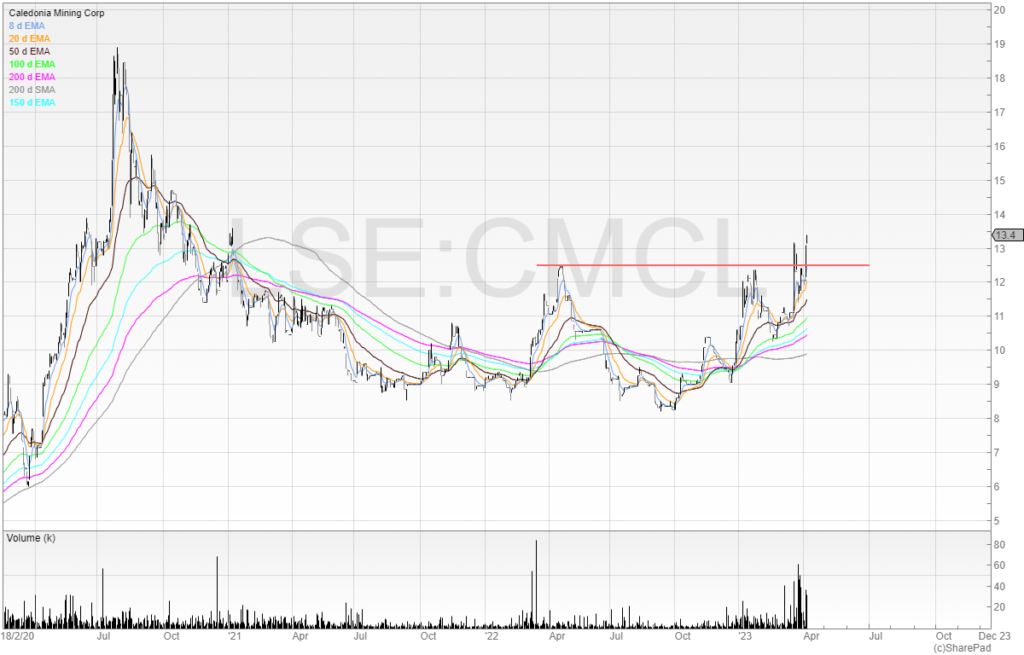
The company did a placing at 1,115p on 24 March and it looks to have been well received, with the shares breaking out of a two-year high.
However, it’s in Zimbabwe. Though that has never been an issue before.
Below we can see Shanta Gold (SHG) which also has a similar chart setup.
Shanta Gold (SHG)

Shanta is potentially interesting. Last October the company was in play with potential offers from Shandong Gold Group, Yintai, and Chaarat Gold Holdings.
This was the reason for the move but since then volume has remained elevated and trend moving upwards.
That’s interesting. Because it means despite the lack of formal offer – demand has remained high in the stock with the price rising. It’s a clear sign of accumulation.
Here’s an excerpt from the annual results:

Note how the Singida project was 90% complete as of 28 March 2023 and on track for first production in… March. That left three days – and three days later the first gold pour at Singida gold mine was announced.
Here’s a direct quote from the results too:
Singida increases Group production by 45-50% to approximately 100,000 oz pa
Shanta Gold Limited – Annual Results for the year ended 31 December 2022
This is the present tense. So not in 2024, or when the mine is fully producing, but now.
House Broker Tamesis has 2023 guidance at 66,000 – 72,000 for Shanta’s flagship asset New Luika gold mine and 32,000pa from Singida pro rata and a target of 88,803 overall.
That’s a big shift from 2022’s 65,209 ounces produced and 2021’s 55,280.
If you believe that elevated gold prices are here to stay then Shanta looks set to capitalise on that with increasing production.
Net profit is forecast to increase to $11.3 million in 2023 (no forecasts for 2024).
That gives a PE of 13.6 for a company set to grow. Gold producers are never going to have exciting rating. But if the gold price ratchets up then so too can the profits as in All-In-Sustaining-Cost falls to $1,167 per ounce.
The chart is also tousling with the 12p resistance zone.

I think it’s worth keeping an eye on Shanta Gold as the price would be breaking out a range set from October 2021.
Finally, there’s another gold play that we’ve not looked at: Thor Explorations.
Thor Explorations (THX)

Thor Explorations owns the Segilola gold mine in Nigeria (the country’s first gold mine).
It produced 98koz of gold in 2022 – the first year of production. Profit before tax is forecast by Cenkos to be $43 million in 2023 with ~$35 million in cash produced – clearing the net debt and leaving a cash position of ~$7 million.
I use Research Tree to get broker forecasts and notes. You always need to be cautious with research as providers are paid by the company to produce notes. But it can help you with market expectations and to get up to speed on a company.
Free trial here: https://www.research-tree.com/partner/shifting-shares
However, it’s in a far away land in Nigeria, and so this is likely to be a reason for a discount.
It’s worth setting an alarm for the breakout and seeing how the company progresses.
If gold continues to move higher then expect people to get excited and gold stocks to get bid up.
I did actually meet this company at a Proactive event last year. The CFO didn’t give the discount rate for his fancy NPV projections. When I asked him he said 5%. Which at the time was almost the risk-free rate from the Bank of England.
Obviously it was done in low-interest environments, but to turn up to an investor meeting and suggest that a gold mine in Nigeria has almost the same risk profile as the Bank of England’s offering is idiotic.
Nice chart though.
Yellow Cake (YCA)
I’ve been long the uranium trade for some time now (September 2021). Somewhat annoying, it’s not done well in terms of price, although the fundamentals for the trade keep strengthening.
The view here is that oil & gas will need to be replaced, renewables are clearly not good enough, and nuclear is both safe and always on.
Nuclear is now considered green by the EU, and a decade long bear market from Fukushima has smashed the uranium price.
Here’s a handy sheet you can use to calculate the discount to NAV using various spot prices for uranium.
I didn’t create this. But given the complexity I assume that it’s likely legitimate.
Yellow Cake is the cleanest way to play the uranium trade because it doesn’t rely on production or exploration. It buys and stores physical uranium (U3O8) in both France and Canada and so can be considered an investment fund correlated to the price of uranium.
It doesn’t hold any exploration or production risk that is inherent to companies with uranium projects and agrees the purchase of uranium before it’s announced to the market which sees shareholders enjoy any uplift in the price.
The company has also executed good capital allocation decisions too – raising money when the trust traded as a premium to NAV and completing share buybacks when the price was sharply below it.
Obviously, there is a storage cost and some other administrative costs, but if you want to play the uranium trade through the spot price, my view is that this is the best instrument.
From a chart perspective the stock looks awful.

I’m long YCA and have a far lower average due to trading around the position. In terms of capital efficiency, this has been a poor trade so far (it’s in the family accounts with a different strategy to my main ones).
But contracting is picking up, and eventually the excess spot will thin out. Market leader Cameco has even been supplying its contracts through buying on the spot market rather than producing itself. Cleverr. It only wants to sell its own uranium at higher prices.
Given all the positive news around nuclear and accelerated builds, at some point I believe it turns. But I could be waiting a while.
Dekel Agrivision (DKL)
This is a company I got stung on last year. It was all my fault.
I bought into the 15-month breakout heavily as Crude Palm Oil prices were going nuts. Unfortunately, the high season didn’t arrive that year and so the anticipation of bumper profits quickly dampened down.
That, and the cashew project delay due to equipment not being shipped from Italy.
I had a big position relative to liquidity and had to keep smacking the bid in order to exit.
Despite that, the price is now trading -50% lower and the high season has arrived in 2023.
The company cautiously hinted at this in its last update.

The company then posted a tweet. I’d argue this is price sensitive information. But that argument would probably fall flat as it didn’t move the price. So I guess it wasn’t!

Here are the WH Ireland (house broker) forecasts for the company.

Being reliant on crude palm oil (CPO) and palm kernel oil (PKO) and the high season means volatility in the company’s earnings.
The introduction of a new commodity in raw cashew nuts (RCN) both increases profits and diversifies the company’s earnings.
However, net debt is high (currently double the market cap) and so that is a concern. But the company generates enough cash for repayment to not be an issue unless it’s recalled early.
Here’s the chart.

It’s worth keeping an eye on this stock and seeing what happens.
But for now it’s terribly illiquid and also in a stage 4 downtrend.
Podpoint (PODP)
This is a company that I successfully shorted last year.

It was an easy short as it was a stage 4 downtrend, the price of electricity was increasing, and the company was burning plenty of cash.
That still remains the case but the company does have a strong balance sheet.. for now.
Here’s the latest chart.

This is looking like a potential stage 1 base to me. It’s been trading in a range since November and has gradually been tightening up.
We can also see that cash isn’t a worry anytime soon. Unless the company fails to start ramping up revenue converting that into cash next year then it may be time to be careful.
But if I was to take this trade, I’d imagine I’d be out well before the end of the year where cash is projected to be £43.9 million (according to Zeus).

Iofina (IOF)
Iofina is a company that produces iodine.
Here’s the long term chart:

Here’s a more recent timeframe.

I was long Iofina in 2022 but eventually ditched it because I lost trust with management.
Every update management had an excuse for why #IO9 was taking so long.
Here’s what I wrote for MoneyWeek:
Construction of its IO#9 plant was ‘in negotiations’ in the interim results in September 2021 and still in negotiations in December 2021 with the company expecting to “finalise an agreement in early Q1 2022”, and “close to finalising an agreement” in April 2022. Management has repeatedly failed to deliver, with zero acknowledgement of previous goals, nor any reason as to why Q1 turned into Q2 which will likely now turn into Q3.
https://moneyweek.com/investments/stocks-and-shares/share-tips/604959/four-more-aim-shares-to-invest-in-today
Turns out I was correct as the terms were finally agreed at the end of October.

But recently the company put out a trading update.
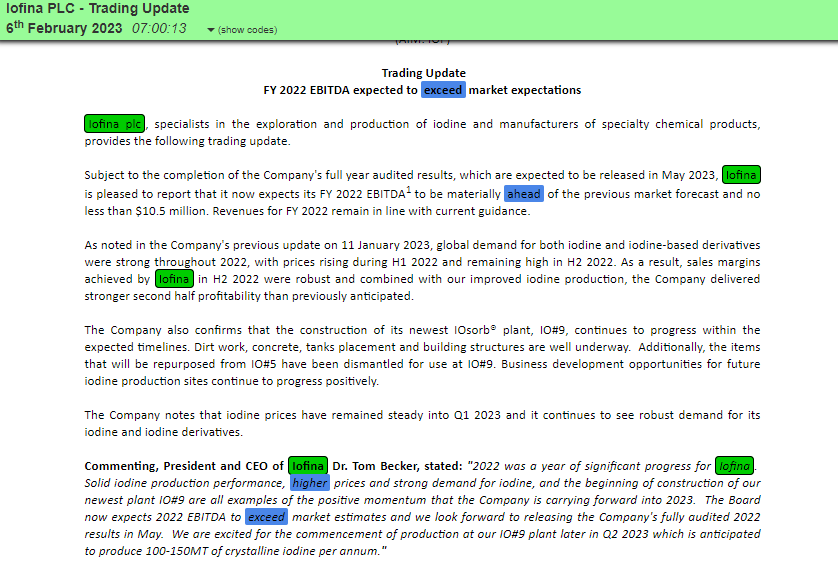
EBITDA is ahead. But revenue is inline. That tells me margins have improved. However, did production not increase by as much as expected and a higher sales price than expected was achieved?
Iodine is an opaque market and prices are impossible to get unless you’re willing to pay a lot of money to Fastmarkets.
But iodine prices staying around $70 or even going higher could excite punters and see a breakout of the stock.
Note the stock is illiquid and production is growing slowly. So this is unlikely to be a huge runaway stock, in my opinion. But there could be a trade in it.
As for the energy stocks, there are a few others worth mentioning..
Journeo (JNEO)
I mentioned Journeo last month and reached out to the chief executive who said we could have another call in a few weeks.
The stock has since broken out and I didn’t get the size I wanted, so I’m probably unlikely to pursue this call unless the stock made a good base again.

I’m still not exactly clear on what opportunity is but it’s a nice trade so far.
Kitwave (KITW)
I always assumed Kitwave was something to do with antennas or radio communications. Probably because of the word ‘wave’.
But it turns out I was wrong.
Kitwave Group PLC is an independent, delivered wholesale business that supports delivery throughout the UK, specializing in selling impulse products such as confectionery, soft drinks, snacks, ice cream, frozen and chilled foods, alcohol, groceries, and tobacco. The company’s reportable segments include Ambient, Frozen and chilled, and Foodservice.
SharePad’s single page summary
But the chart is a thing of beauty.
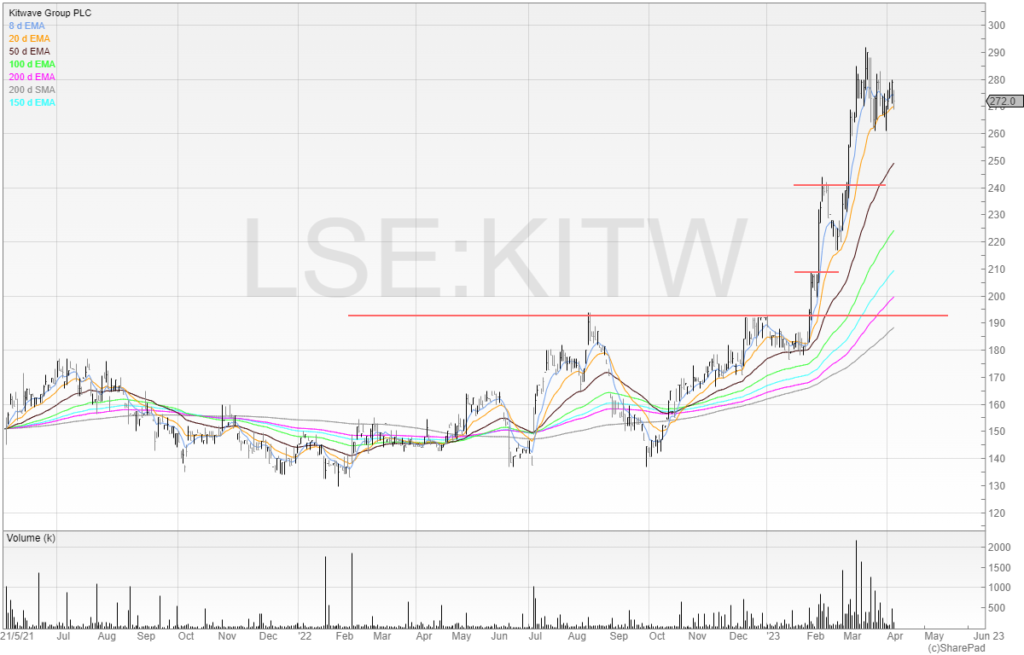
I’m annoyed at myself for not spotting this earlier. There’s no excuses as it would’ve been showing up on the 10% within 52-week high filters on SharePad. Which means if you’re using it then there’s no excuse for you either!
Notice how the volume has ramped up since the breakout which is a clear sign of accumulation.
We’ve seen a steep rally quickly over the course of a few months so it wouldn’t surprise me if we see consolidation and a range begin.
But if the stock breaks out I think getting on board the trend could be a nice trade. Betting on charts like this is how you make money in stocks.
Gattaca (GATC)
I dislike this share because it’s a recruiter and recruitment companies aren’t that exciting.
But I thought that years ago and didn’t take this trade.
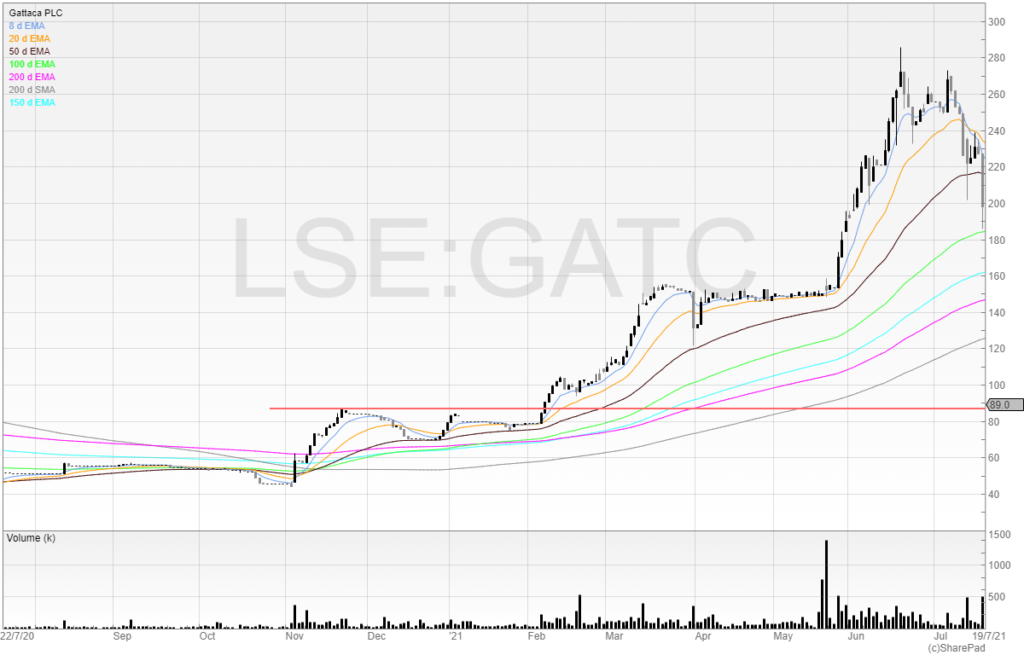
We’ve gone through stage 4, stage 4, and are we now back at stage 1 again?

Just because the stock broke out and rallied sharply before doesn’t mean it’ll do it again. The macroenvironment is different.
And this is why I saw that you trading will always require an element of discretion. You can systemise lots of things (and you should systemise lots of things) but market conditions are always different, stocks are always different, and sure you can quantify the setups themselves but there will always be differences.
Maybe the balance sheet is weak this time around? Maybe we’re at the start of a bear market? Or the end when everyone is terrified? You’ll always have to make a judgement call.
But looking at the chart here, I can’t fault it much.
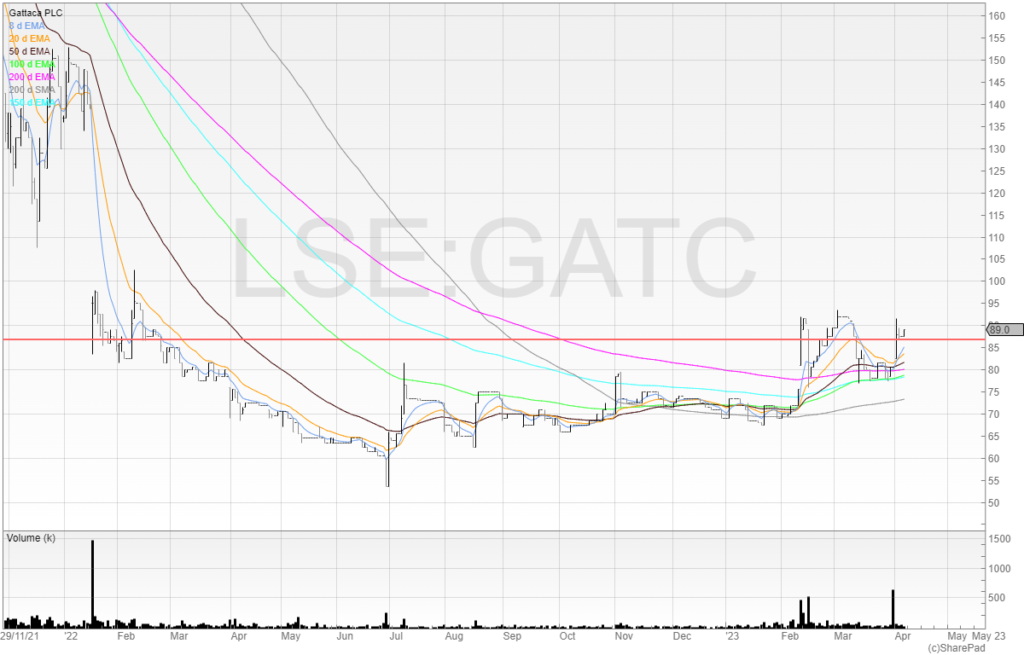
The results are flat and there isn’t much to get excited about.
But if it’s a move-to-move trade then does it matter?
Ending note..
Thanks for reading! I appreciate it.
I think I might’ve found another potential tech multibagger. The chart is great but I need to do the work and assess the risk/reward properly. If I think it is then I’ll be writing it for the next issue.
I’ll be at the Master Investor show this Saturday on a panel (use the code SHIFTINGSHARES for a free ticket) and also giving a talk at the IX Investor Show on 28 April too. Tickets are free if you’re quick!
You can see the updated stock library below.
The April edition will be out on Tuesday May 9th.
Have a great month. Play tight!
Stock library
List of stocks mentioned:
888 Holdings – 888
February 2023
AAZ – Anglo Asian Mining
April 2023
AO. – AO World.
January 2023
ATM – Andrada Mining
January 2023
AURA – Aura Energy
March 2023
BMN – Bushveld Minerals
February 2023
BOTB – Best of the Best
February 2023
March 2023
BRH – Braveheart
February 2023
BSFA – BSF Enterprises
February 2023
Caledonia Mining Corporation
April 2023
DKL – Dekel Agrivision
April 2023
DOTD – Dotdigital
February 2023
GATC – Gattaca
April 2023
IGR – IG Design
January 2023
February 2023
IMMO – Immotion
February 2023
IOF – Iofina
April 2023
JET – Just Eat Takeaway
January 2023
February 2023
JNEO – Journeo
March 2023
April 2023
KITW – Kitwave
April 2023
MMAG – Music Magpie
February 2023
NGHT – Nightcap Group
January 2023
February 2023
PODP – Podpoint
April 2023
RBG – Revolution Bars Group
January 2023
RENX – Renalytix
February 2023
RNK – Rank Group
January 2023
ROO – Deliveroo
January 2023
SHG – Shanta Gold
April 2023
THX – Thor Explorations
April 2023
VIC – Victorian Plumbing
March 2023
YCA – Yellow Cake
April 2023
Thanks for this Michael very good read as always. I am pretty new to trading and brought JNEO on the breakout after putting it on my watchlist following you highlighting last month. My question is what signs are you looking for to give you an indication to exit the trade? Appreciate it is an art not a science.
Cheers
Matt